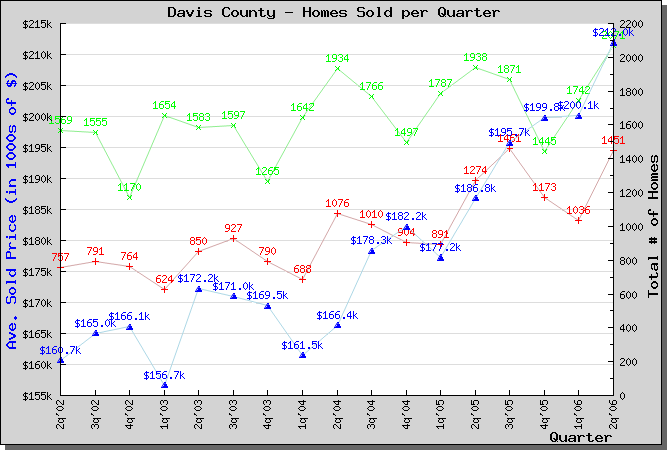
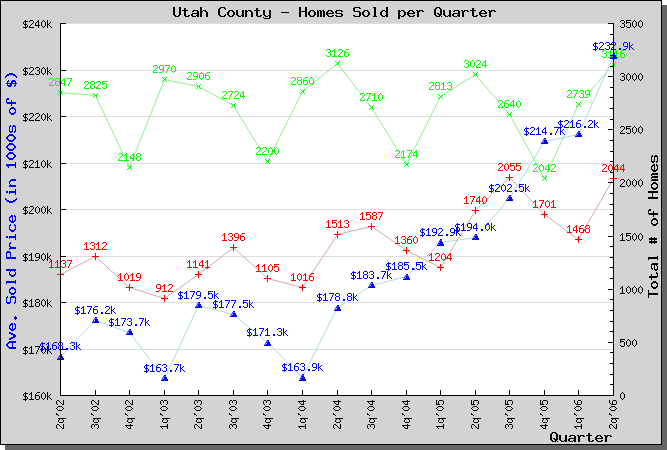


Here are some recent figures regarding Utah's Real Estate marketplace. the chart below shows price range, number of homes on the market, and average days on the market.
| Listings: 1 | Residential Market Summary | Date: 09/12/2006 05:30 PM |
State:UT Status:1
| Active Listings | ||||
| $0 | - | $9,999 | 25 | 114 |
| $10,000 | - | $19,999 | 38 | 120 |
| $20,000 | - | $29,999 | 47 | 73 |
| $30,000 | - | $39,999 | 49 | 94 |
| $40,000 | - | $49,999 | 60 | 73 |
| $50,000 | - | $59,999 | 72 | 94 |
| $60,000 | - | $69,999 | 100 | 90 |
| $70,000 | - | $79,999 | 124 | 83 |
| $80,000 | - | $89,999 | 156 | 87 |
| $90,000 | - | $99,999 | 161 | 65 |
| $100,000 | - | $119,999 | 332 | 59 |
| $120,000 | - | $139,999 | 493 | 51 |
| $140,000 | - | $159,999 | 481 | 46 |
| $160,000 | - | $179,999 | 578 | 45 |
| $180,000 | - | $199,999 | 622 | 49 |
| $200,000 | - | $249,999 | 1,338 | 51 |
| $250,000 | - | $299,999 | 1,279 | 56 |
| $300,000 | - | $349,999 | 1,028 | 55 |
| $350,000 | - | $399,999 | 824 | 58 |
| $400,000 | - | $449,999 | 570 | 58 |
| $450,000 | - | $499,999 | 537 | 58 |
| $500,000 | - | $599,999 | 663 | 63 |
| $600,000 | - | $699,999 | 449 | 64 |
| $700,000 | - | $799,999 | 287 | 65 |
| $800,000 | - | $899,999 | 186 | 69 |
| $900,000 | - | $999,999 | 125 | 66 |
| $1,000,000 | - | $1,249,999 | 123 | 85 |
| $1,250,000 | - | $1,499,999 | 112 | 79 |
| $1,500,000 | - | $1,749,999 | 64 | 119 |
| $1,750,000 | - | $1,999,999 | 74 | 121 |
| $2,000,000 | - | $2,499,999 | 49 | 131 |
| $2,500,000 | - | $2,999,999 | 48 | 116 |
| $3,000,000 | - | $3,999,999 | 36 | 129 |
| $4,000,000 | - | $4,999,999 | 14 | 113 |
| $5,000,000 | - | and over | 21 | 147 |
The average listed home along the Wasatch Front (including all price ranges, HUD homes, short sales, and bank-owned homes) has been on the market for 60 days.


No comments:
Post a Comment